 We now have a Universe of stars,
galaxies, and dark matter. We will describe the first two in detail (sadly, we know little
about dark matter). We start with stars.
 We now have a Universe of stars,
galaxies, and dark matter. We will describe the first two in detail (sadly, we know little
about dark matter). We start with stars.
The sun shows us the workings of a star, and has both obvious and subtle influences on life on Earth.
Key points: Composition of the sun; granules, sunspots, flares, prominences; solar cycle; role of magnetic fields
The sun is the source of almost all energy on the earth; it is also
important to astronomers as the sun is the only star whose surface we can study.The sun
has also been a subject of worship in most early societies ![]()
(From MSFC,
http://science.msfc.nasa.gov/ssl/pad/solar/images/sunturn.gif)
Much of what we know about stars in general is derived from our detailed knowledge of the sun,
Sun has a diameter = 10 times Jupiter's or 110 times Earth's
Sun has a mass = 1000 times Jupiter's or 330,000 times Earth’s
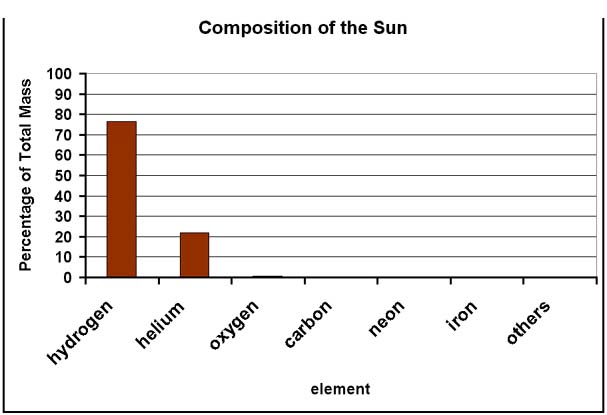 |
The sun is nearly all hydrogen and helium, with traces (less than 2% by mass in total) of elements with heavier nuclei. (G. Rieke) |
Output of the Sun
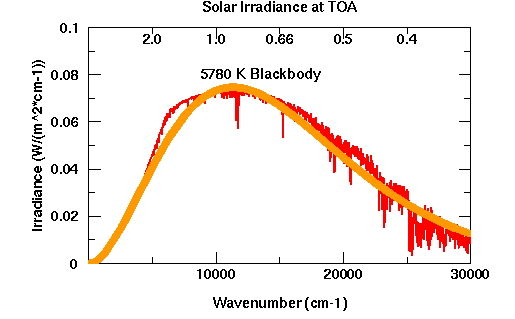 |
Like many other astronomical objects, the sun radiates energy almost as though it were a true blackbody (the output of a 5780K blackbody is in orange, that of the sun in red, wavelengths across the top). http://climate.gsfc.nasa.gov/~cahalan/Radiation/SolarIrrVblackbody.html |
The energy received from the sun over a fixed area diminishes inversely as the square of the distance from the sun (recall inverse square law discussion).
Thus, the energy received from the sun, sometimes called
the solar constant, depends on its temperature, surface area, and our distance from it. From the record of
fossils on the earth, we know that solar constant and hence the Sun's output has been
nearly constant for more than 3 billion years![]() The total
energy emitted (if we could capture the energy in all directions) is the luminosity = 3.9x1026 watts. All this energy has to flow out through the solar surface.
We discuss its characteristics next.
The total
energy emitted (if we could capture the energy in all directions) is the luminosity = 3.9x1026 watts. All this energy has to flow out through the solar surface.
We discuss its characteristics next.
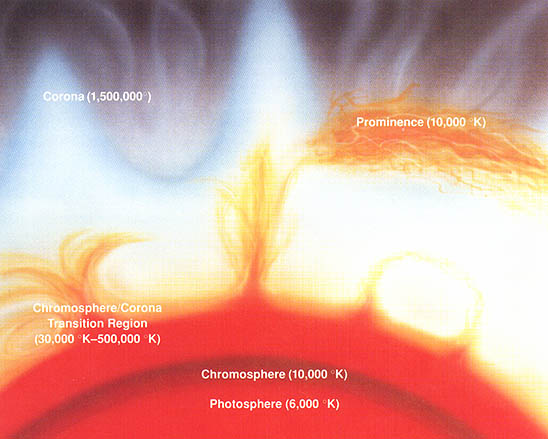 |
The photosphere is the visible surface of the sun -- the layer of the sun where the hot gases become opaque. T~6000 K here. The chromosphere is a thin, hot layer of gas above the photosphere, T~varies rapidly, with a typical value of 10,000 K, in the chromosphere. The corona is rarefied, very hot gas moving away from the sun due to convection. It merges with the solar wind. T~1,500,000 K in the corona. Prominences erupt from the photosphere through the chromosphere and into the corona (from NASA History Project, http://history.nasa.gov/NP-119/ch4.htm) |
 |
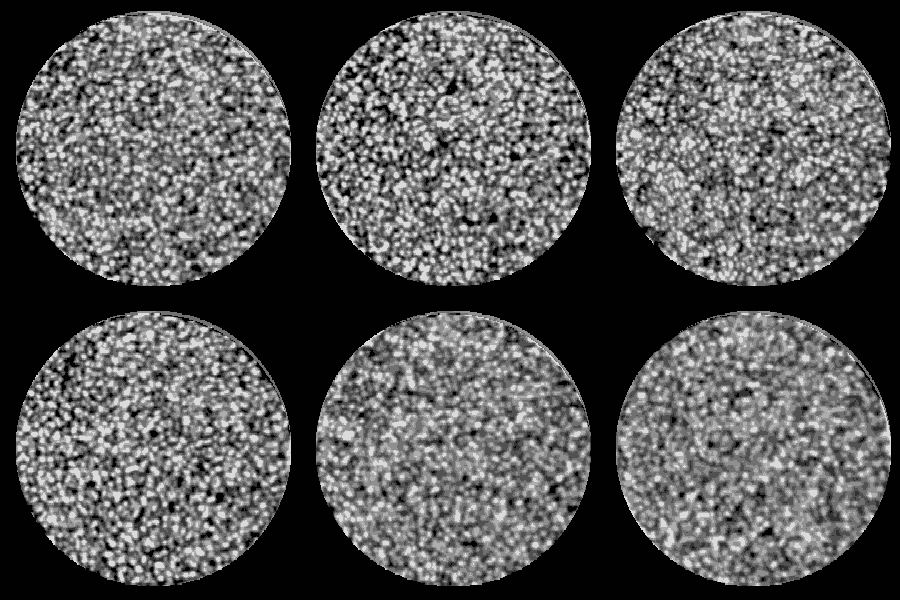 |
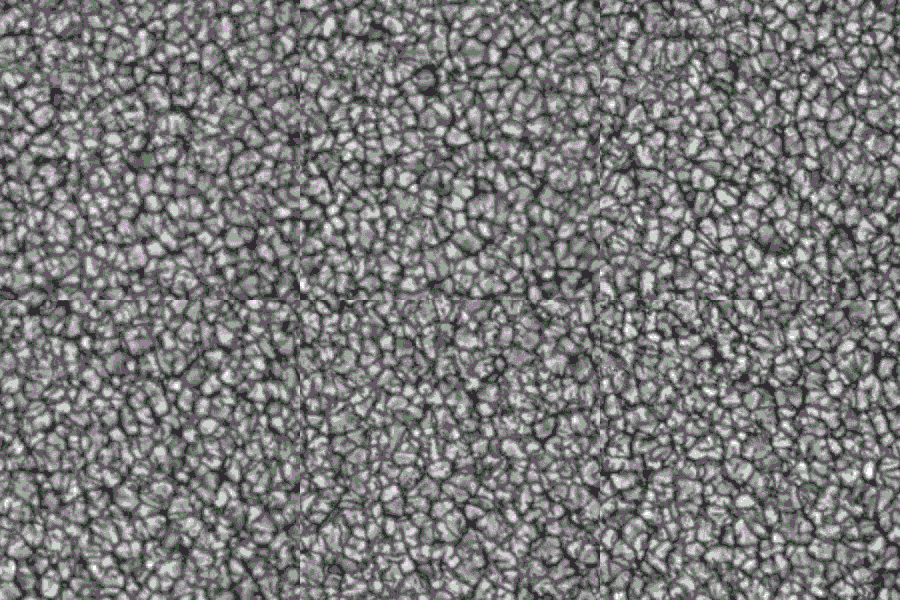
Granules are convection from inside the sun; they subdivide the photosphere into 1000-2000km cells that look like rice grains or kernels of corn. (From MSFC solar physics, http://science.msfc.nasa.gov/ssl/pad/solar/feature1.htm, and Thomas Straus, http://www.na.astro.it/~straus/04_science/) |
 |
A sunspot is a magnetic storm in the photosphere that is cooler than the surrounding region -- it looks black only by comparison with the hotter surroundings -- T~4,000 K, compared with T~5700 K for the surroundings. (From Vacuum Tower Telescope, NSO, NOAO, via APOD: http://antwrp.gsfc.nasa.gov/apod/ap051106.html) |
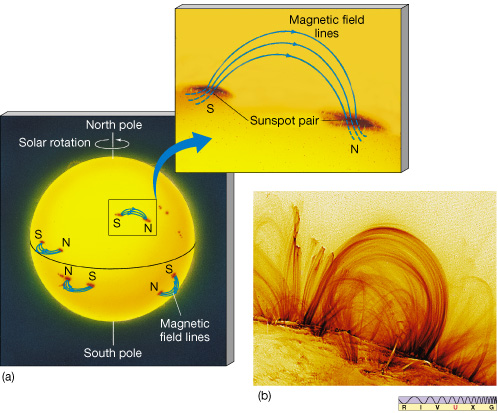 |
Because sunspots are magnetic, they occur in pairs where one is a north pole while the other is a south pole. Every 11 years, the more western parts of sunspot pairs will change from magnetic N to magnetic S (or vice versa). (From Chaisson & McMillan, Astronomy Today) |
|
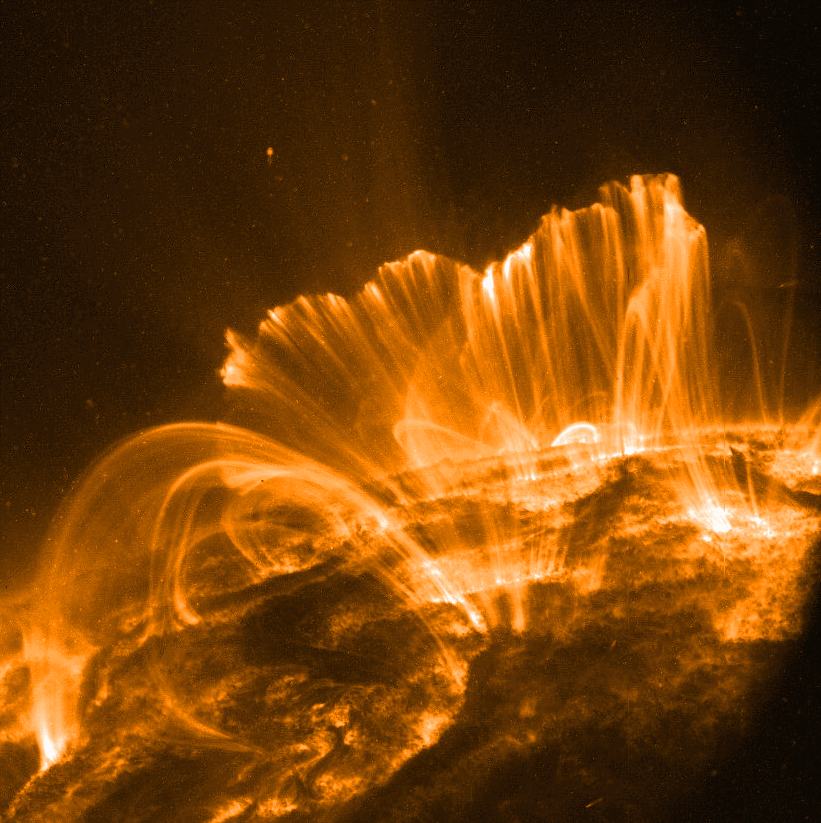
To the right, a huge filament of gas lifts off. http://ali.apple.com/space/images_sun.shtml |
|
 |
|
A solar prominence from the TRACE satellite. |
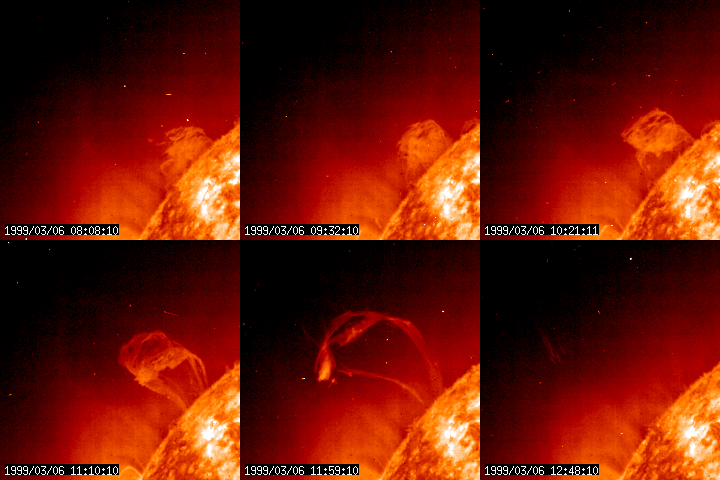
An eruptive prominence from the SOHO satellite (From Solar Data Analysis Center, GSFC, http://umbra.nascom.nasa.gov/) |
 |
 |
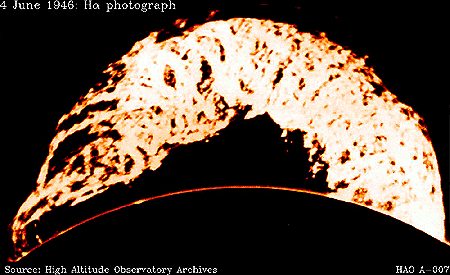 |
Flares and prominences are clouds of gas that erupt from disturbed regions near sunspots. The sun's magnetic field can hold them in place for days. (From High Altitude Observatory, http://web.hao.ucar.edu/public/education/slides/slide7.html) |
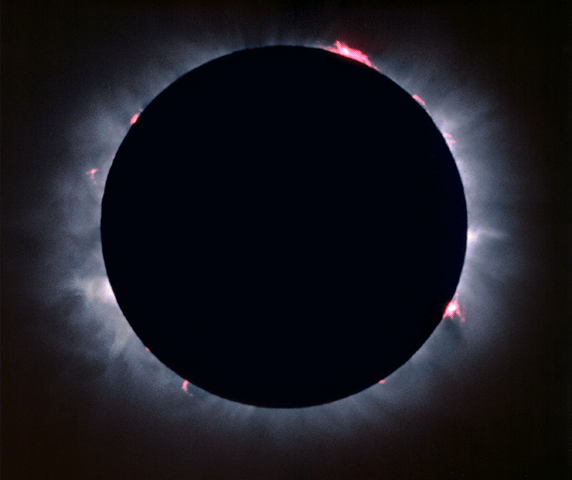 |
Eclipse pictures make many of these structures highly visible. |
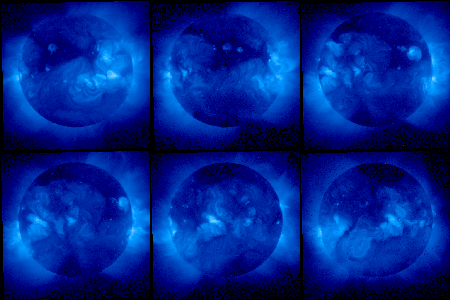 |
The activity of the sun is much more apparent at x-ray wavelengths (from Yokoh public outreach project) |
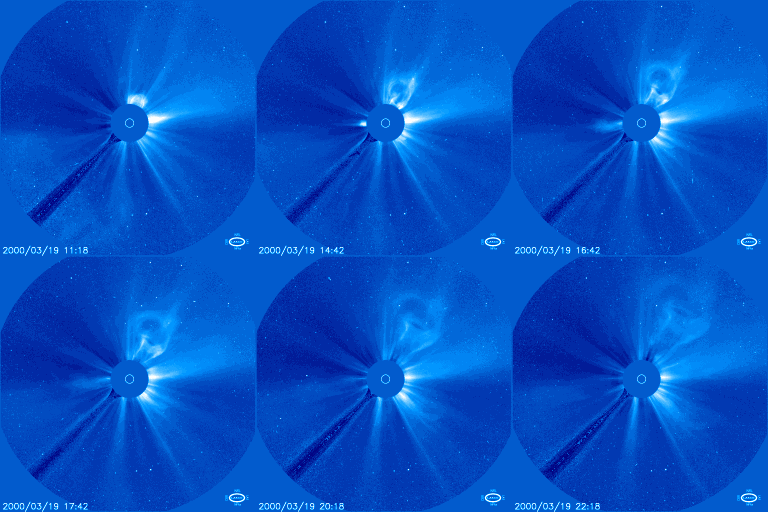 |
The solar wind is a stream of particles evaporating from the sun's surface. Major episodes of mass flow into the wind are called coronal mass ejections, and they can result in large fluxes of particles at the earth (if they are injected into magnetic lines of force that carry them to us rather than in some other direction). They can cause dramatic aurorae, disrupt radio communications, and have other effects. (From SOHO, LASCO http://lasco-www.nrl.navy.mil/rtmovies.html) |
http://www.solar.ifa.hawaii.edu/MWLT/Today/latest.jpg
| The number of
sunspots varies over an 11-year period. As the number of sunspots rises
from "solar minimum" to "solar maximum", the numbers of flares and
prominences also rise. With all this activity, many more energetic particles are ejected
increasing the "radioactivity" in space near the earth. (From Linford and Slater, http://solar.physics.montana.edu/YPOP/Spotlight/Tour/tour07.html) |
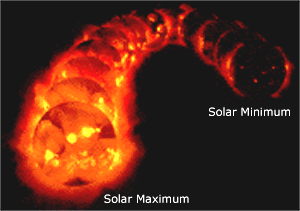 |
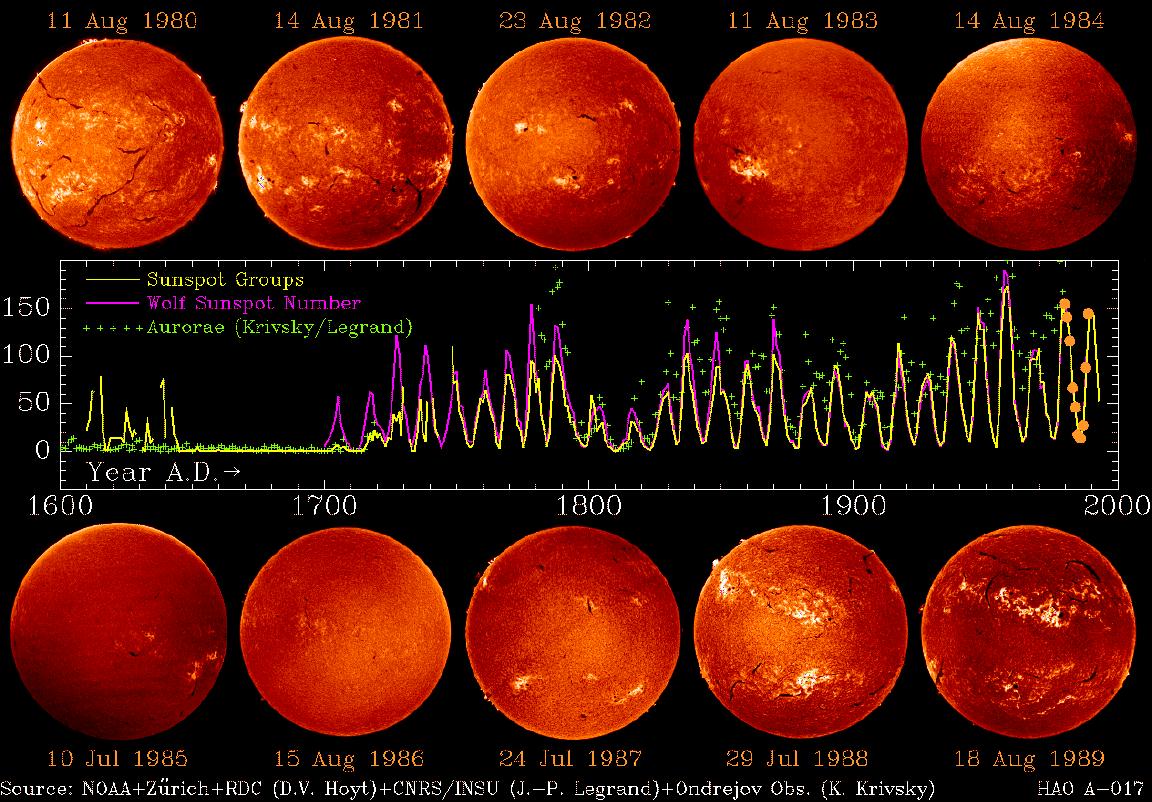
| This series of pictures of the sun is similar to the superimposed ones above, but shows the change in activity in more detail. The graph down the center gives the number of sunspots every year we have records, starting in about 1600. The repeating peaks are at the solar maximum every 11 years. (From Yokoh public outreach, http://solar.physics.montana.edu/YPOP/Spotlight/Tour/images/cycle2.jpeg) |
 |
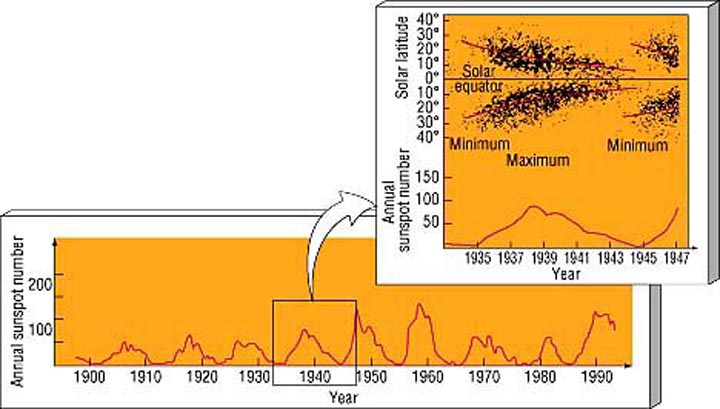
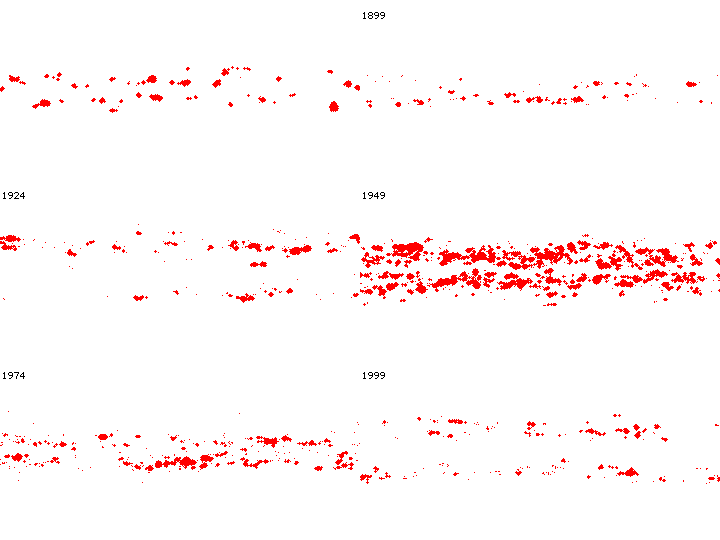
| Another pattern that follows the number of sunspots is their location -- near minimum, sunspots are found initially close to the sun's equator and then switch to high solar latitudes (closer to the poles), while near maximum they are found in between.(From Chaisson & McMillan, Astronomy Today; animation from http://home.daviel.org/sunspots/) |
 |
 |
Over a 22-year period (2 times the solar maximum period), the numbers and N/S magnetic patterns of sunspots repeat. We call this 22-year period the Solar Cycle.
1) Because the sun is comprised of gas and is not solid, different latitudes rotate at different speeds with the equator taking only about 25 days to rotate once while the pole takes closer to 30 days.
2) The sun has a magnetic field.
3) The magnetic field is tied to the gas that makes up the sun and rotates with it.
| At sunspot minimum, the magnetic field is relatively straight like lines of latitude. Because the equator rotates faster than the poles (differential rotation), as time goes on the field gets twisted. During the course of 11 years, the magnetic field becomes so twisted and tangled that some of the field breaks through the Sun's surface causing sunspots. The process of tangling is stopped when the system suddenly relaxes to the straight lines and the sun's overall magnetic field reverses for the next 11 years. (from http://sohowww.nascom.nasa.gov) |
|
 |
Flares and prominences are correlated with sunspots because broken magnetic field lines that break through the surface help gas escape from the sun's surface.
Test your understanding before going on![]()
Learn more about the sun at:
http://www.astro.uva.nl/demo/od95/
|
Computer simulation of galaxy formation in the early Universe; Univ. of Chicago Center for Cosmological Physics, http://cfcp.uchicago.edu/research/theory/ |
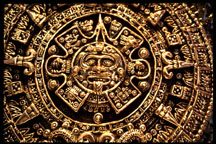
Aztec calendar stone; Tonatiuh, sun god, is in the center. from http://www.windows.ucar.edu/tour/link=/mythology/planets/sun.html |
|
Click to return to syllabus |
||
| Click to return to the Era of Atoms and Galaxies | hypertext |
Click to go to Interior of the Sun |