What are the properties of stars other than the sun?
| Stars: What We Can Learn About Them? | "All men have stars, ...but they are not the same things for
different people. For some, who are travelers, the stars are guides. For others, they are
no more than little lights in the sky. For others, who are scholars, they are
problems....."
- Antoine de Saint-Exupery, The Little Prince |
Key points: Basic parameters of stars - luminosity, temperature, size, mass, composition - and how they are determined
The sun is a star. In general, a star is an object making its own energy and that is (or was) capable of sufficiently high central temperature and pressure that nuclear reactions can occur.
Stars are so distant (the next nearest is 260,000 times further away than the sun) that we see them only as points of light.
Fundamental Stellar Properties
The ones we can determine are few![]() :
:
Luminosity = total energy emitted (conventionally measured in solar luminosities, L![]() )
)
Size
Mass (conventionally measured in solar masses, M![]() )
)
Composition - what the star is made of
The first three are not independent -- they are related
to each other by the radiation laws.![]()
If we can learn so little about them, why do
we study other stars![]()
Luminosity: distance combined with apparent brightness
Distance: trigonometric parallax
Temperature: either from colors (and blackbody laws) or more detailed spectra
Diameter: Luminosity combined with temperature
Mass: Binary star orbits and Kepler's Laws
Composition: Spectra
Because the distances are so large, we use special units:
light years = 1016 meters or parsecs = 3.26 light years = 3.086x10¹⁶meters
(a light year is the distance light travels in a year.)![]()
We will quote distances in parsecs, abbreviated as pc, for much of the rest of the course; for really large distances we will use a unit of kpc (kiloparsecs - 1000pc) or Mpc (megaparsecs - 1,000,000pc).
 |
The only direct way to measure stellar distances is through
parallaxes - the change in direction toward a nearby star due to our change in position as
the earth goes around its orbit. See how the parallax is reduced when the distance of the
star increases in this animation. Animation by R. Pogge, http://www-astronomy.mps.ohio-state.edu/~pogge/Ast162/Movies/parallax.html). |
After Kepler and Newton, it was obvious that parallax should be observable, but it was still nearly two centuries before a stellar parallax was first measured -- by Bessel in 1838. The problem was that the stars are so distant that parallax is very small and difficult to measure.
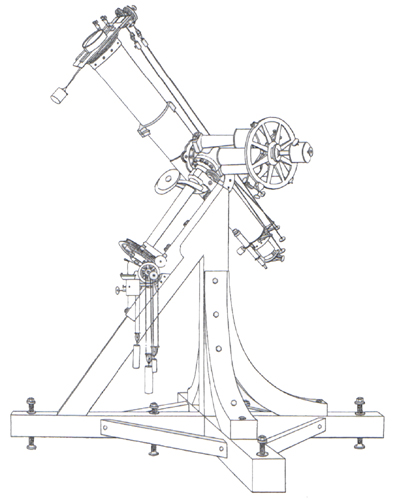 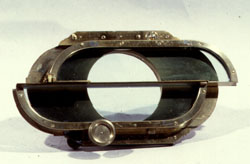 |
| Bessel used a special telescope where the lens had been cut in half and the two halves could be offset with a precision adjustment. Dudley Observatory, http://www.dudleyobservatory.org/index.asp?pg=Exhibits/bessel.htm Museo della Specola, Bologna, http://stars.bo.astro.it/dip/Museum/english/can_41.html |
This gave him two images of the field. He could offset these images to
superimpose the images of two different stars and then measure their separation by the
amount of lens offset required to bring the images together. In this way, and with great
care and perseverance he was able to make accurate measurements.![]()
Distances can be deduced indirectly in many other ways. For example, if many stars are together in a cluster, they will all be at the same distance and if we can figure out the distance for one, we know it for all of them.
The luminosity of a star is one of its fundamental parameters -- the luminosity is a direct measure of the rate at which nuclear fusion is proceeding in the star's core.
Astronomers tend to use a logarithmic scale for brightness called magnitudes. We will not
use them in this course, but if you are taking another astronomy course and using our
notes for review, for example, you can learn how they work here ![]()
Luminosity, apparent brightness, and distance are linked through the radiation laws, so if we know any two we can compute the third - for example, if we can estimate the luminosity without knowing the distance and can measure the apparent brightness, we can calculate the distance.
 Annie Jump Cannon developed the system of stellar
classification used today and published the 9 volumes of the "Henry Draper
Catalog" classifying 225,000 stars. She managed to maintain uniform criteria for this
whole work!
Annie Jump Cannon developed the system of stellar
classification used today and published the 9 volumes of the "Henry Draper
Catalog" classifying 225,000 stars. She managed to maintain uniform criteria for this
whole work!
More about "Miss Cannon" at http://www.wellesley.edu/Astronomy/Annie/
Cannon's system ranked the stars alphabetically in order of the strength of their hydrogen absorption lines, with the strongest A0...A9, B0...B9, C.., etc.
It became obvious near the end of this work that the
differences in the low resolution spectra used for classification were dominated by
temperature differences.![]() The hydrogen lines are strongest for intermediate temperatures, near 10,000K. At higher
temperatures, the electrons are stripped from the nuclei and there are no lines, while at
lower temperatures the atoms are in their "ground" state and cannot absorb
efficiently in visible light lines. In order of temperature, high to low, Cannon's system
comes out:
The hydrogen lines are strongest for intermediate temperatures, near 10,000K. At higher
temperatures, the electrons are stripped from the nuclei and there are no lines, while at
lower temperatures the atoms are in their "ground" state and cannot absorb
efficiently in visible light lines. In order of temperature, high to low, Cannon's system
comes out:
30,000oK ------------------------->3,000oK
Sometimes recited as:
Oh, be a fine girl, kiss me.
Cecilia Payne-Gaposhkin worked out the physics that proved that the stars are all mostly made of hydrogen and that the sequence of stellar spectral types is a temperature sequence.
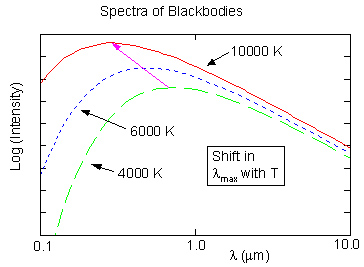 |
Why didn't "Miss Cannon" use
the colors and Wien's Law to get temperatures?
There is dust between the stars that makes them look more red than they really are, and by amounts that vary in unpredictable ways. |
From the Stefann-Boltzmann
Law, E=![]() AT4, (energy from a blackbody is equal to a
constant times the area of the blackbody times the temperature to the fourth power), we could estimate a star's luminosity IF we also knew its surface area (which we rarely
do!):
AT4, (energy from a blackbody is equal to a
constant times the area of the blackbody times the temperature to the fourth power), we could estimate a star's luminosity IF we also knew its surface area (which we rarely
do!):
where r is the radius of the star. Instead, we turn the equation around and use it to compute the radius of the star.
 |
Eclipsing binaries are pairs of stars whose orbits are aligned along our line of sight so that one passes in front of the other: They can provide a check on the computed sizes by measuring the duration of the eclipses and the stellar velocities. (Animation from R. Pogge, http://www-astronomy.mps.ohio-state.edu/~pogge/Ast162/Movies/eclbin.html) |
For nearby, luminous (and hence large) stars, we can measure sizes directly with interferometers -- these cases provide the tests that the other methods are reliable.
are obtained from multiple star systems.
-- about half of all stars are found in systems of several stars orbiting each other. Binary stars are systems with only two members.
Visual binaries are separated enough on the sky that both members can be seen and studied, and their orbits can be measured:
 |
Here is a simulation of two equal-mass stars orbiting each other (from http://en.wikipedia.org/wiki/File:Orbit5.gif) |
 |
 |
In both the examples to the left, the mass of the blue star is 3.6 times greater than of the red one. Animations from R. Pogge, http://www-astronomy.mps.ohio-state.edu/~pogge/Ast162/Movies/visbin.html) |
Notice how the sizes of the orbits (and the periods around them) depend on the masses of one star relative to the other. By plotting the orbit and measuring the period, Kepler's Law can be used to determine the masses of the stars:
-- here P is the period of the orbits of the stars around each other, a is their separation, G is the gravitational constant, and their masses are M1 and M2 (technically this gives only the sum of the masses of the two stars but by making a few other measurements such as radial velocities the actual values can be determined).
 |
Spectroscopic binaries are pairs too close together to be seen as separate stars, but whose spectral lines can be seen separately (and which move relative to each other as the stars move around their orbits): The observer is measuring the system from the direction of the yellow dot to the far left. Animation from R. Pogge, http://www-astronomy.mps.ohio-state.edu/~pogge/Ast162/Movies/specbin.html) By observing spectroscopic binaries, we have greatly increased the number of stars for which we have information on masses. |
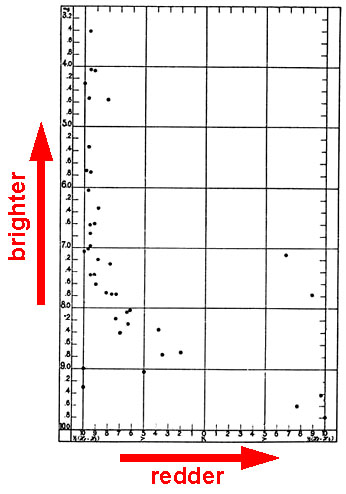 |
Ejnar Hertzsprung was a chemist and amateur
astronomer. He used spectra of stars in the Pleiades to classify them
according to the strengths of the hydrogen and calcium lines (an earlier
implementation of the classification perfected by Annie Jump Cannon). When
he graphed the classifications compared with the star brightnesses, he found
that the redder stars were systematically fainter. Since all the stars were
at the same distance (in a single stellar cluster), this showed that the red
stars were intrinsically fainter, or less luminous. (See http://www.leosondra.cz/en/first-hr-diagram/)
Later, Henry Norris Russell plotted the luminosities and colors for all the stars for which adequate data existed and confirmed these patterns: stars are not found all over this diagram but only in a few regions. The temperatures and luminosities are related in a specific way for most stars, as shown in the Hertzsprung-Russell, or H - R, diagram. Most stars lie along the main sequencethat extends from the low luminosity, low temperature corner to the high luminosity, high temperature one. Hertzsprung and Russell, and Leavitt had discovered a behavior of stars relating luminosity and temperature. |
 |
Here is an example. We explain B - V colors below. The diagram is
equivalently a plot of backwards running temperature (running across the top
in this example) against luminosity.
(from http://csep10.phys.utk.edu/astr162/lect/sun/spectrum.html). |
 |
"Colors" referred to the differences in brightnesses at two different wavelengths (in this case, blue and visible). The colors provided an indication of stellar temperature.The "B - V color" in the HR diagram above stands for the ratio of brightness in the yellow to that in the blue, in units such that 0 is a star that is very bright in the blue and 2 is one that is very faint. Therefore, the scale is like a backwards temperature scale with the high temperatures to the left and the low ones to the right (see scale at the top). (from http://csep10.phys.utk.edu/astr162/lect/sun/spectrum.html). |
With the help of the radiation laws to relate sizes, temperatures, and luminosities, the diagram "decodes" as follows:
 |
Here the horizontal axis is labeled with temperature in place of color. According to the radiation laws, a very luminous cool star must be very large, while a very hot but low luminosity star must be very small. From Gene Smith, http://casswww.ucsd.edu/public/tutorial/ |
Perhaps in the discussion above you noticed a change in
the type of astronomer involved![]()
Test your understanding before going on![]()
Aten, Egyptian god of the sun, |
|
Einstein |
Click to return to syllabus |
||
| Click to return to the Sun | hypertext |
Click to go to Modern Physics |
