The Multiwavelength Milky Way
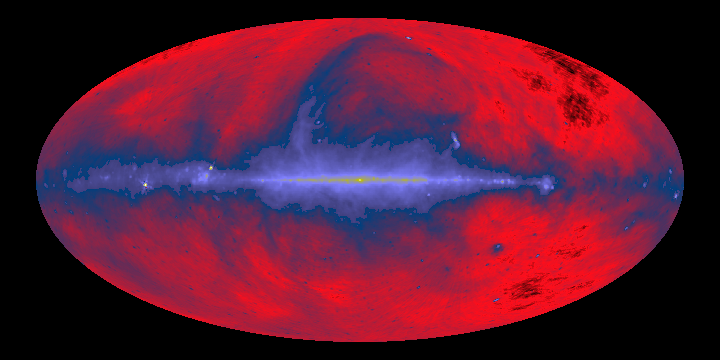
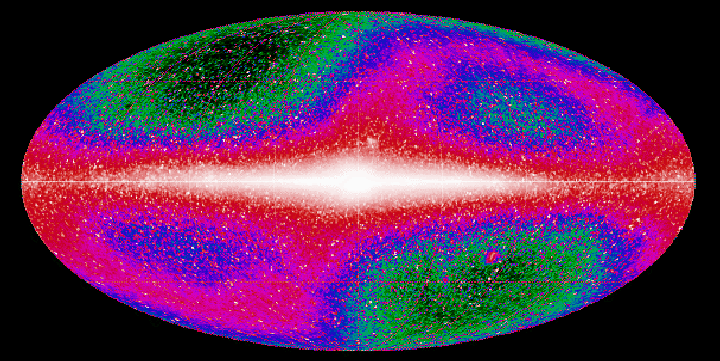
We get more insights to our galaxy by studies at a range of wavelengths. Below are views of the whole sky centered on the center of the Milky Way, respectively in the radio, near infrared, and visible (from http://www.ipac.caltech.edu/Outreach/Multiwave/gallery3.html)
 |
The radio "sees" mostly the regions where cosmic rays circulate in the plane of the galaxy, plus some star forming regions and huge arcs of gas blown into space above and below the plane. |
 |
The near infrared "sees" the true distribution of stars, relatively unaffected by interstellar dust. |
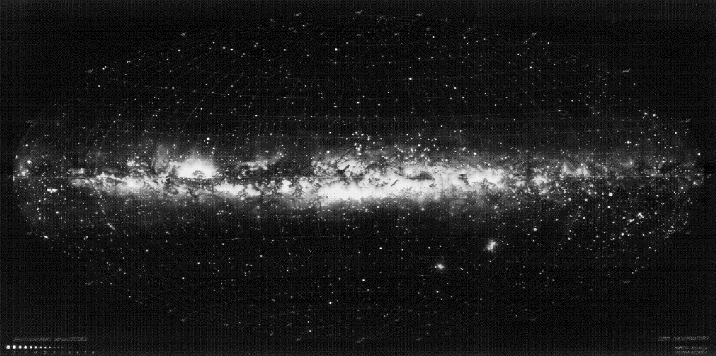 |
The visible sees nearby stars, but the view is highly restricted in the plane by the interstellar dust. |
Here is an expansion to other wavelengths, concentrating just on the central region of the galaxy
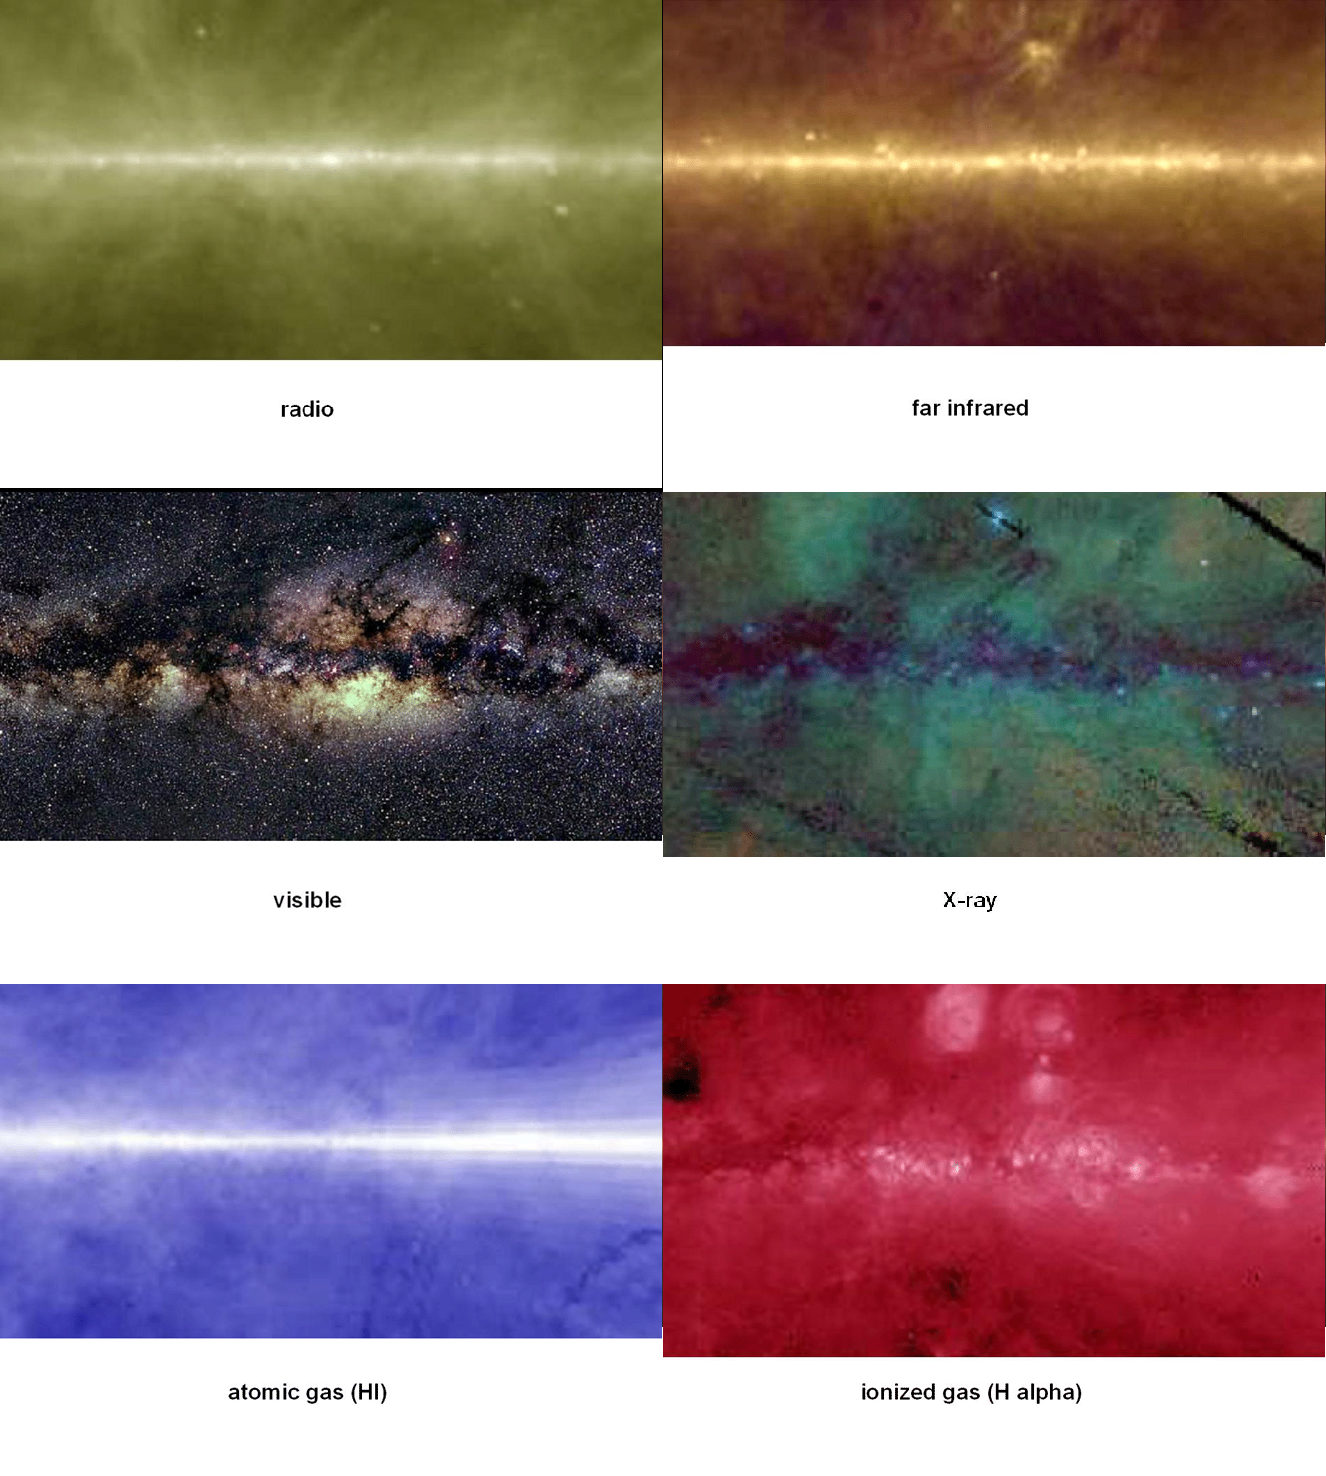
from R. Arendt, http://homepage.mac.com/rarendt/dirbe_qtvr/b123.html and A. Mellinger, http://adc.gsfc.nasa.gov/mw/milkyway.html and the 2MASS project, http://www.ipac.caltech.edu/2mass/gallery/showcase/allsky_stars/index.html
 |
 |
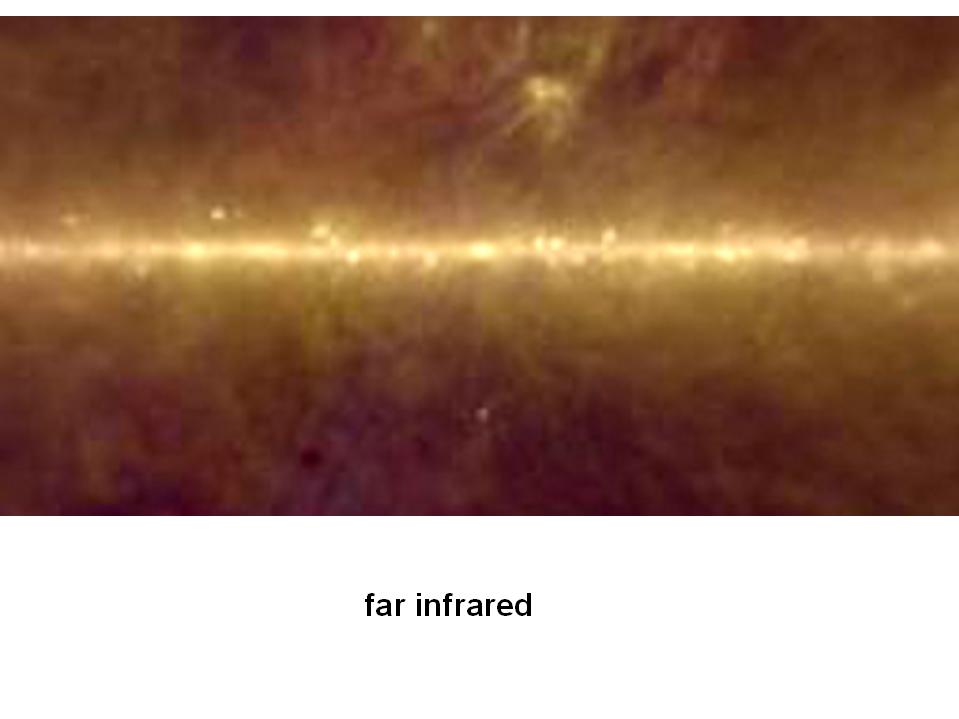 |
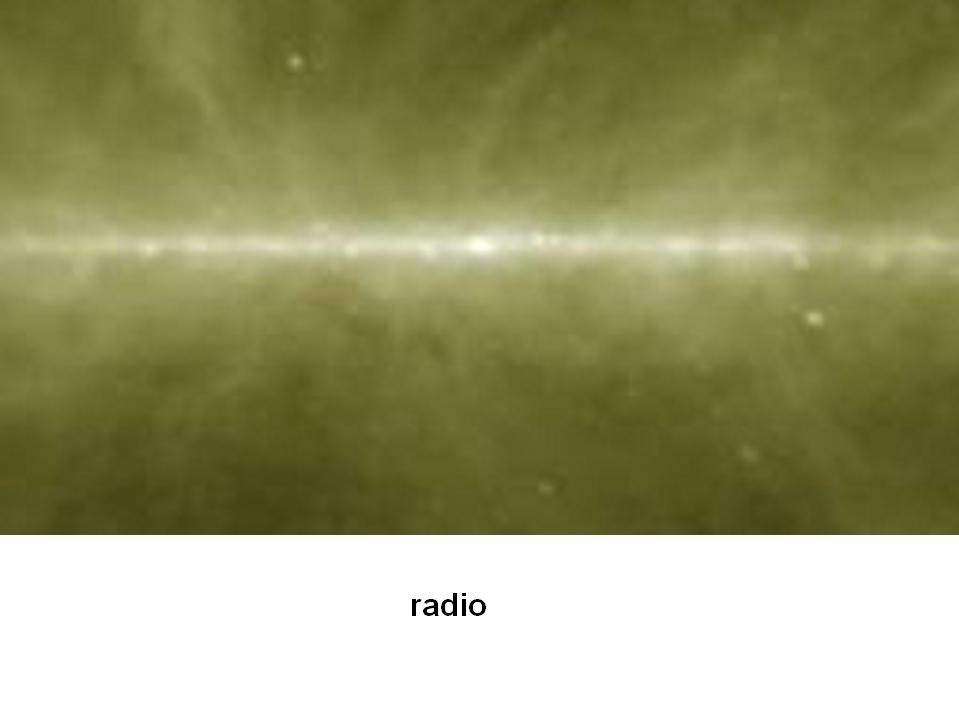
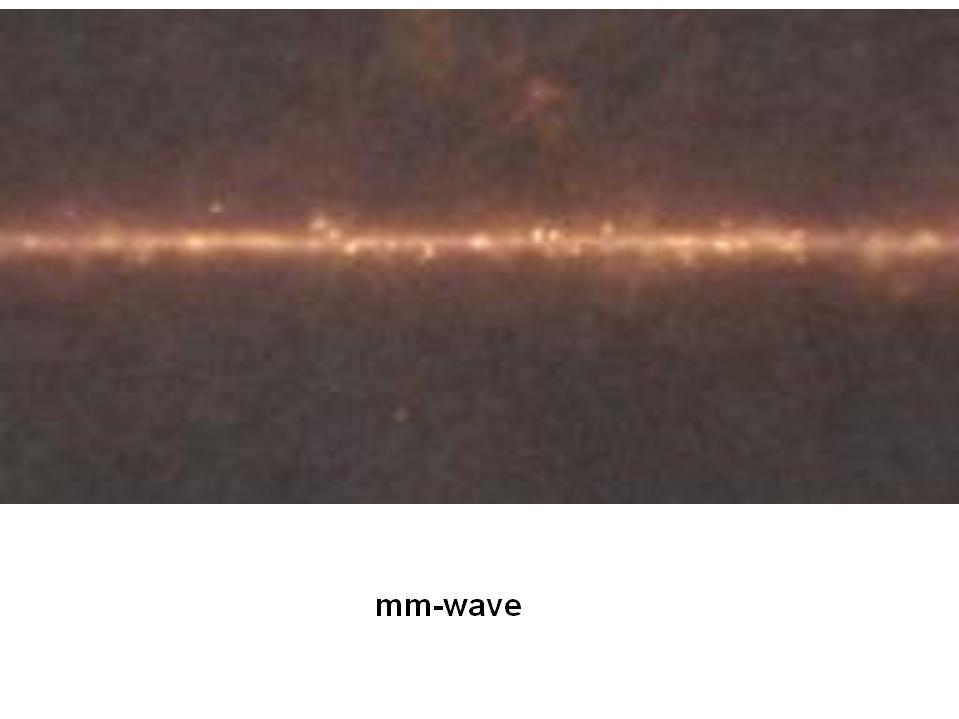
| The radio, mm-wave, and far infrared images are all remarkably similar along the plane of the Galaxy. In this region, they all trace the most recently formed massive stars, although the photons are generated in three different ways. The radio emission shows where there are very high energy electrons accelerated by supernovae and related events. The mm-wave shows where ultraviolet light from hot stars excites the interstellar gas. The far infrared is produced when local sources of energy heat interstellar dust. Out of the plane of the galaxy, the radio image looks different from the other two because it shows where the high energy particles are streaming out of the galaxy confined by large scale magnetic fields. | ||
 |
 |
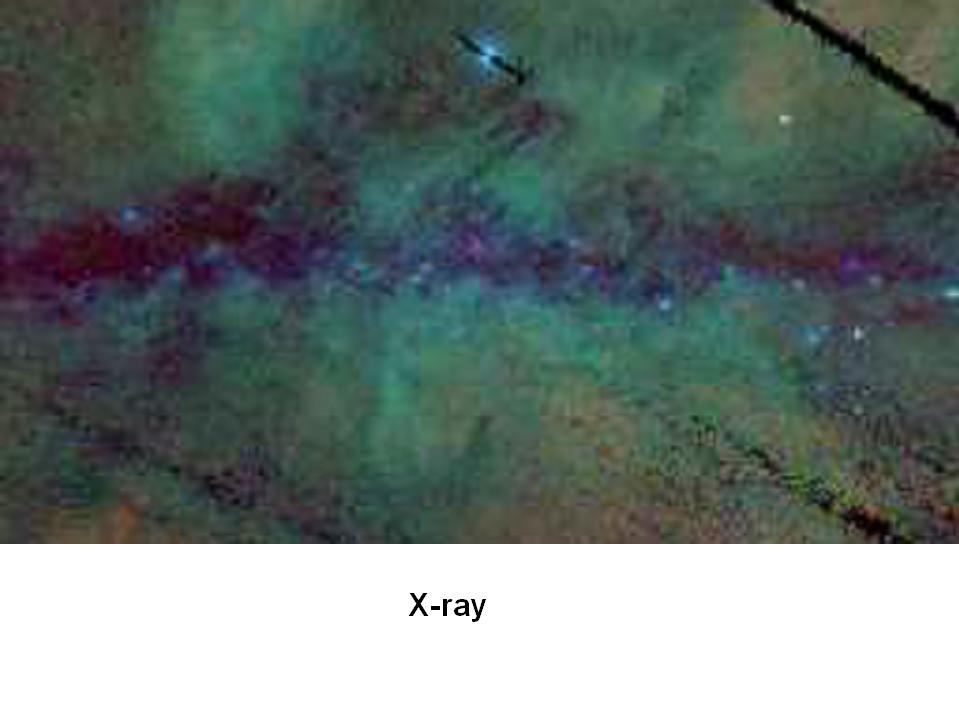 |
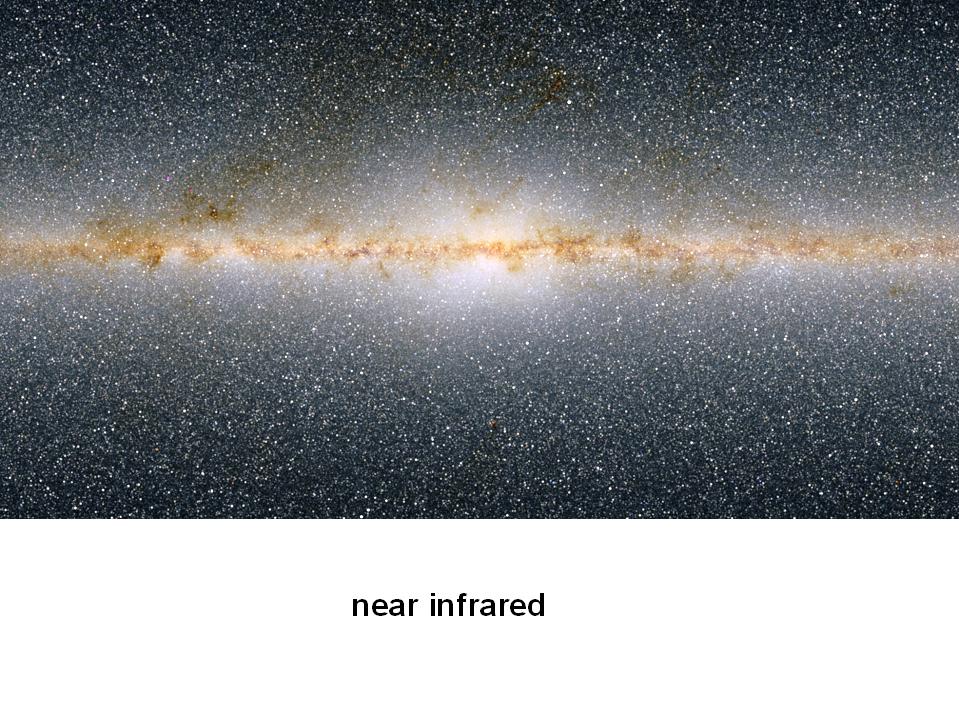
| The near infrared is the best tracer of "average" stars and reveals the overall structure of the Galaxy as an edge-on spiral. We also start to see the effects of obscuration of the plane of the Galaxy by interstellar dust. This obscuration dominates the view in the visible and confines the information there to nearby stars and the large scale extend of the Galaxy out of the plane towards its center. The X-ray emission also shows this obscuration, but this time against the general diffuse extragalactic X-ray emission. Many of the individual sources seen in the X-rays are binary stars, where a massive companion (neutron star, black hole) is accreting matter from a normal star. | ||
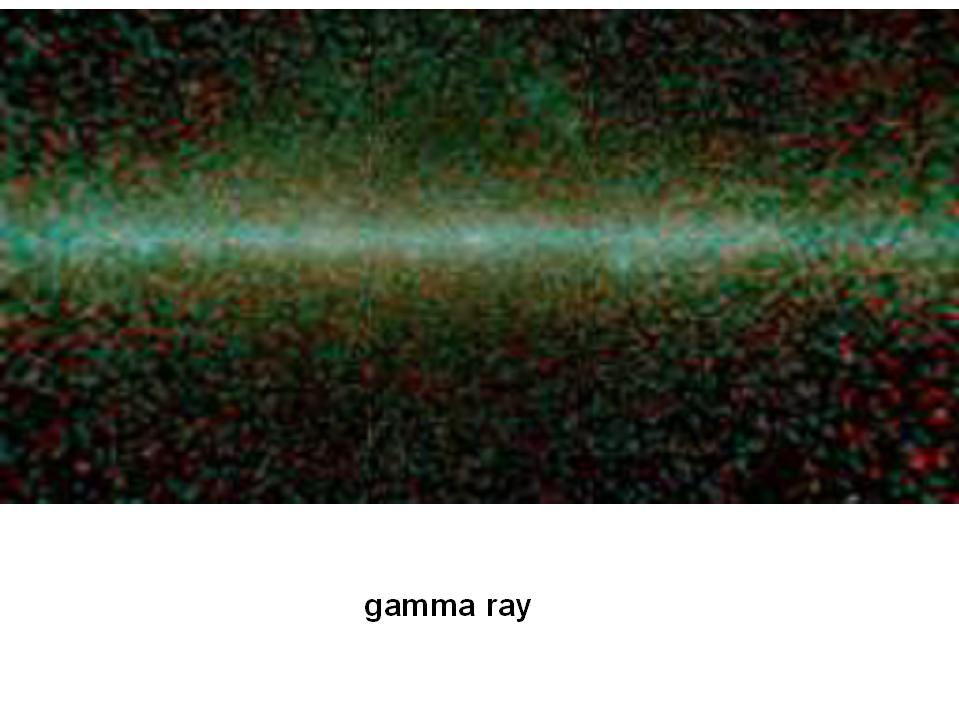 |
The gamma ray map shows where cosmic rays collide with gas, and the peaks in the map coincide with molecular clouds where the gas density is high. |
 |
 |
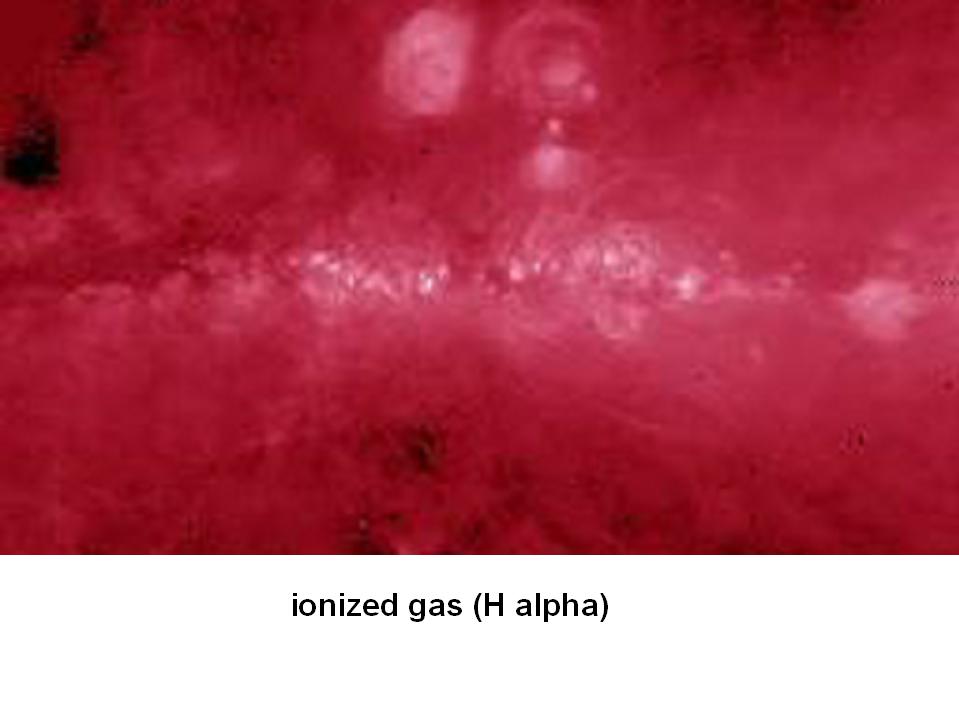 |
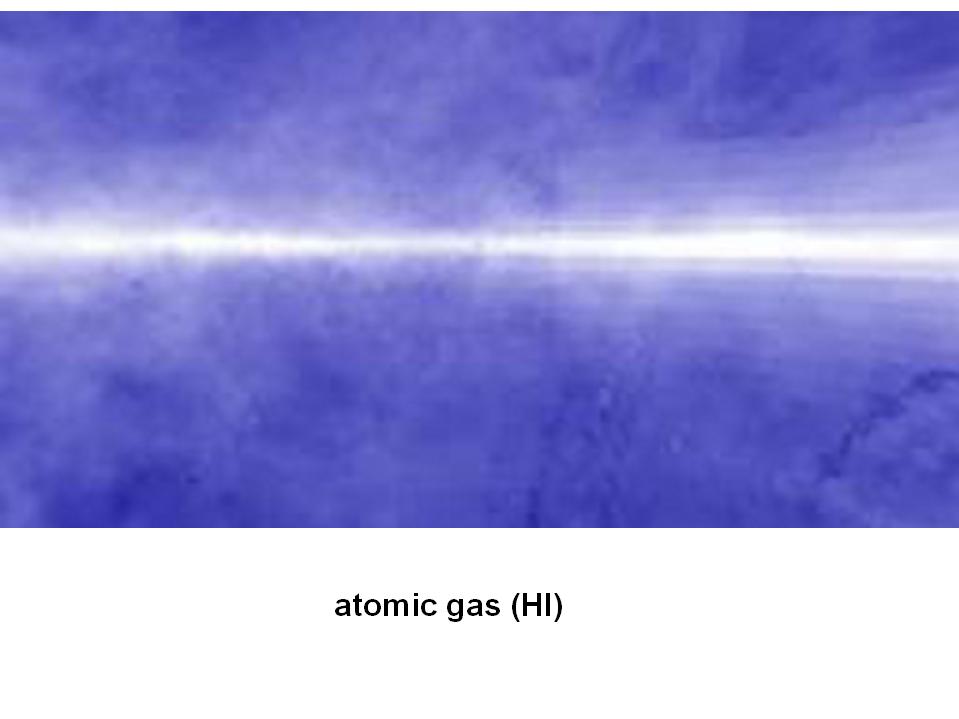
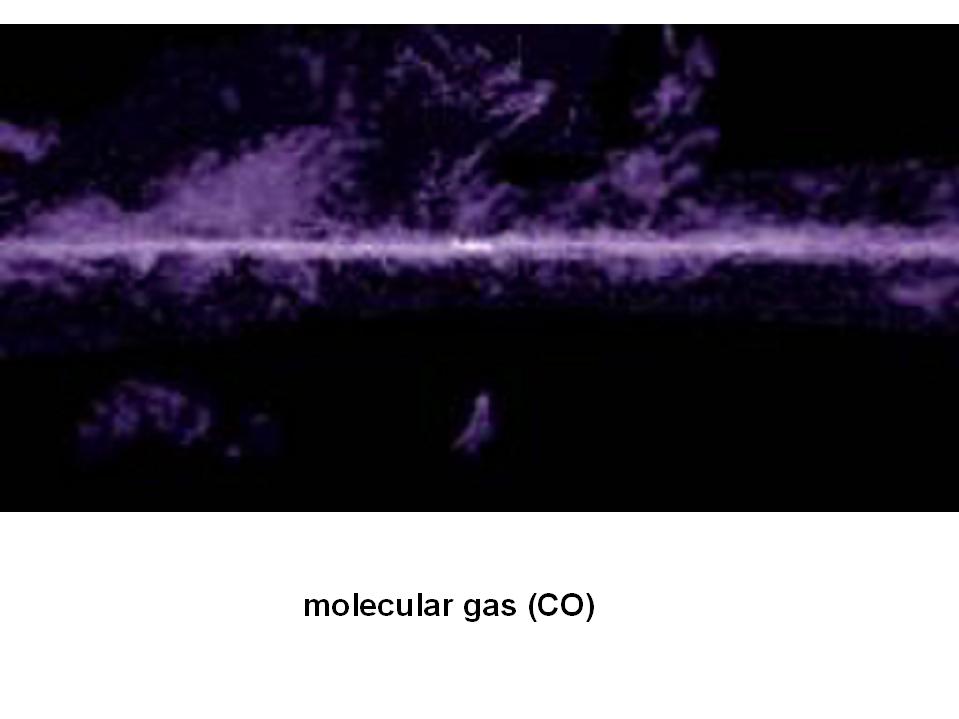
| The atomic hydrogen image is the best tracer of the gas in the system. It extends all the way around the sky, 180o in either direction from the center. This is why the atomic hydrogen line is so useful for tracing the rotation curve.The molecular gas is traced by measurements of emission by carbon monoxide (CO). It is concentrated in the plane of the Galaxy. Since it is the raw material for making new stars, where there are high concentrations (molecular clouds), we tend also to get star forming regions. The center of the system is not prominent in either atomic hydrogen or molecular gas, since the gas is mostly in the plane. The ionized gas is traced in the right-hand picture by the hydrogen alpha emission line. The measurements are strongly affected by extinction toward the plane of the Galaxy, but the image shows how there are nearby structures of gas that project far out of the plane of the Galaxy and that are lit up by ultraviolet photons from young stars. | ||