Measuring the ages of stars
The procedure for assigning an age to a cluster consists of
1) Measure brightnesses and colors of many stars in the cluster (ideally one would take a spectrum of each star in the cluster but this usually takes too long)
2) Correct measurements for any dimming caused by interstellar material
3) Plot an H-R diagram
4) Use models of stellar evolution to find the main sequence turn off and then the age of the cluster.
 |
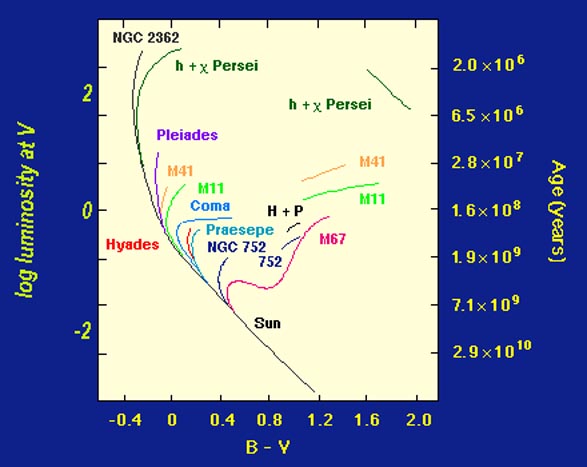
A series of clusters is plotted on this H-R diagram, from very young (h & X Persei) to very old (M67). (this illustration and following ones from U. Tenn, http://csep10.phys.utk.edu/astr162/lect/hr/hr.html) |
 |
 |
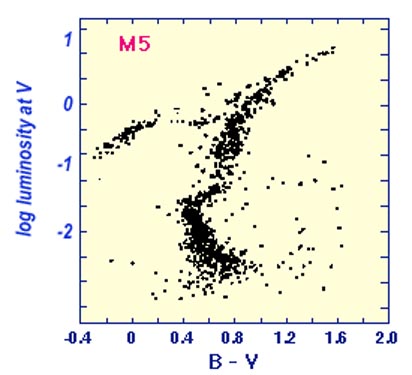
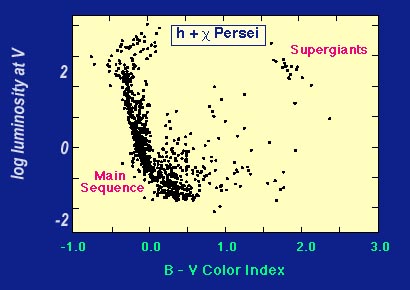
| An old cluster | And a young one. |
 |
A few stages in the evolution of a cluster as they would appear on the H-R diagram. This figure extends from the lowest mass to the highest mass stars. (adapted by G. Rieke, from T. Herter, http://instruct1.cit.cornell.edu/courses/astro101/astro101.htm) |
Our understanding of stellar evolution is pieced together from relating stars to each other in different clusters of different ages. We make use of the Russel-Vogt Theorem, that stars are basically simple and their properties depend only on mass, age, and composition