Logarithms
Logarithms are a way of plotting numbers in scientific notation. The logarithm of a number, written log(number), is the power of ten that it equals. Here are some examples:
log (102) = 2
log (1043) = 43
log (10-4) = -4.
Logarithms can also express numbers that are not even powers of ten. For example, 3.16 = 100.5, so
log (3.16) = 0.5.
The logarithm of a number times another number is the sum of the logarithms of the numbers, so
log (3.16 x 10³ ) = 0.5 + 3 = 3.5.
Although this is potentially a large subject, these short notes should help you understand graphs in terms of logarithms, which we will use from time to time in this course because they are the only way to plot scientific notation without losing its ability to express a large range of values.
Here are some examples, from Joshua Barnes' course notes http://www.ifa.hawaii.edu/~barnes/ast110_06/sosat.html#[3].
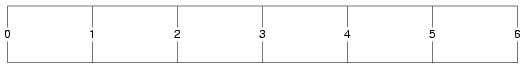
An ordinary ruler is a good example of a linear scale:
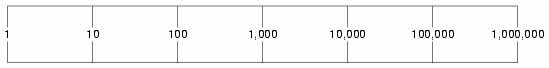
A logarithmic scale is labelled a bit differently:
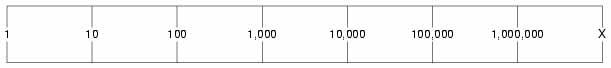
Let's extend the logarithmic scale one space to the right as shown. What is the value of X?
Answer: #3
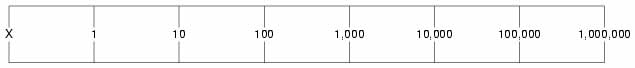
Now, let's extend the logarithmic scale one space to the left as shown. What is the value of X?
Answer: #2
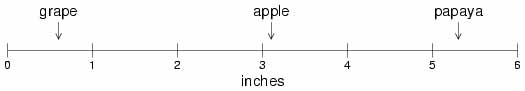
A linear scale is fine for comparing sizes of different kinds of fruit:
It's also fine for comparing diameters of different planets:
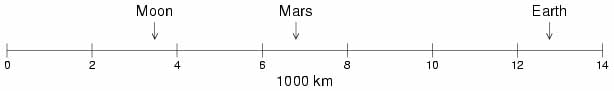
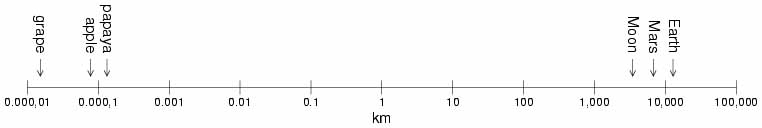
But it's useless if you want to compare fruit and planets on the same scale!
Using a logarithmic scale, we can easily plot fruit and planets together: