Key points: Recombination and its significance; imprint of structures on the cosmic background; determining if the Universe is at the critical density; dark matter
Era of Nucleosynthesis

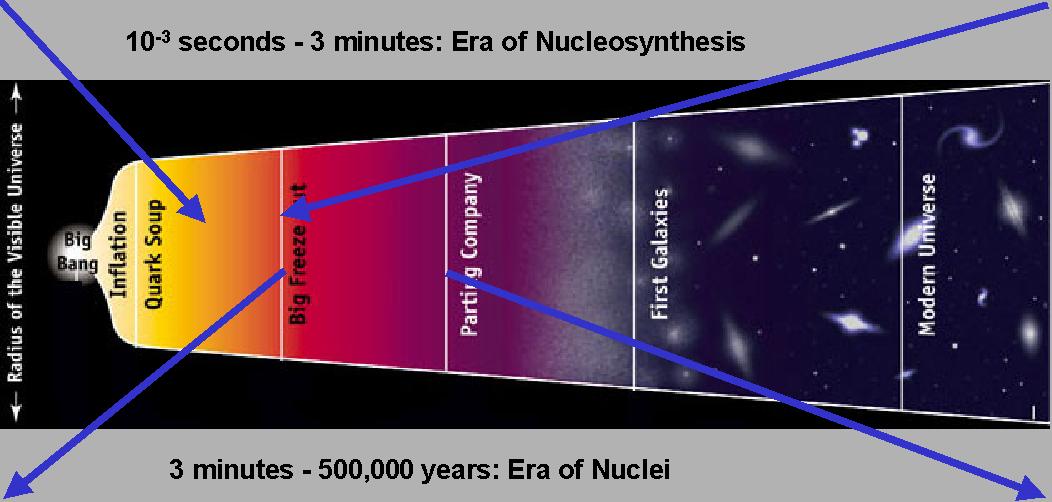
Nuclear reactions could occur until about 3 minutes after the Big Bang. At this point the temperature became too low for them to continue. However, the temperature remained high enough to keep all the atoms ionized (electrons free from the nuclei) until about 300,000 - 500,000 years past the beginning. Because free electrons can absorb photons of any energy, the Universe was opaque to light until it reached this age. Hence the photons heated the matter to the same temperature they were at. Then, a change took place that meant that the matter no longer absorbed the photons efficiently. They no longer heated the matter, and it started to cool and clump together.
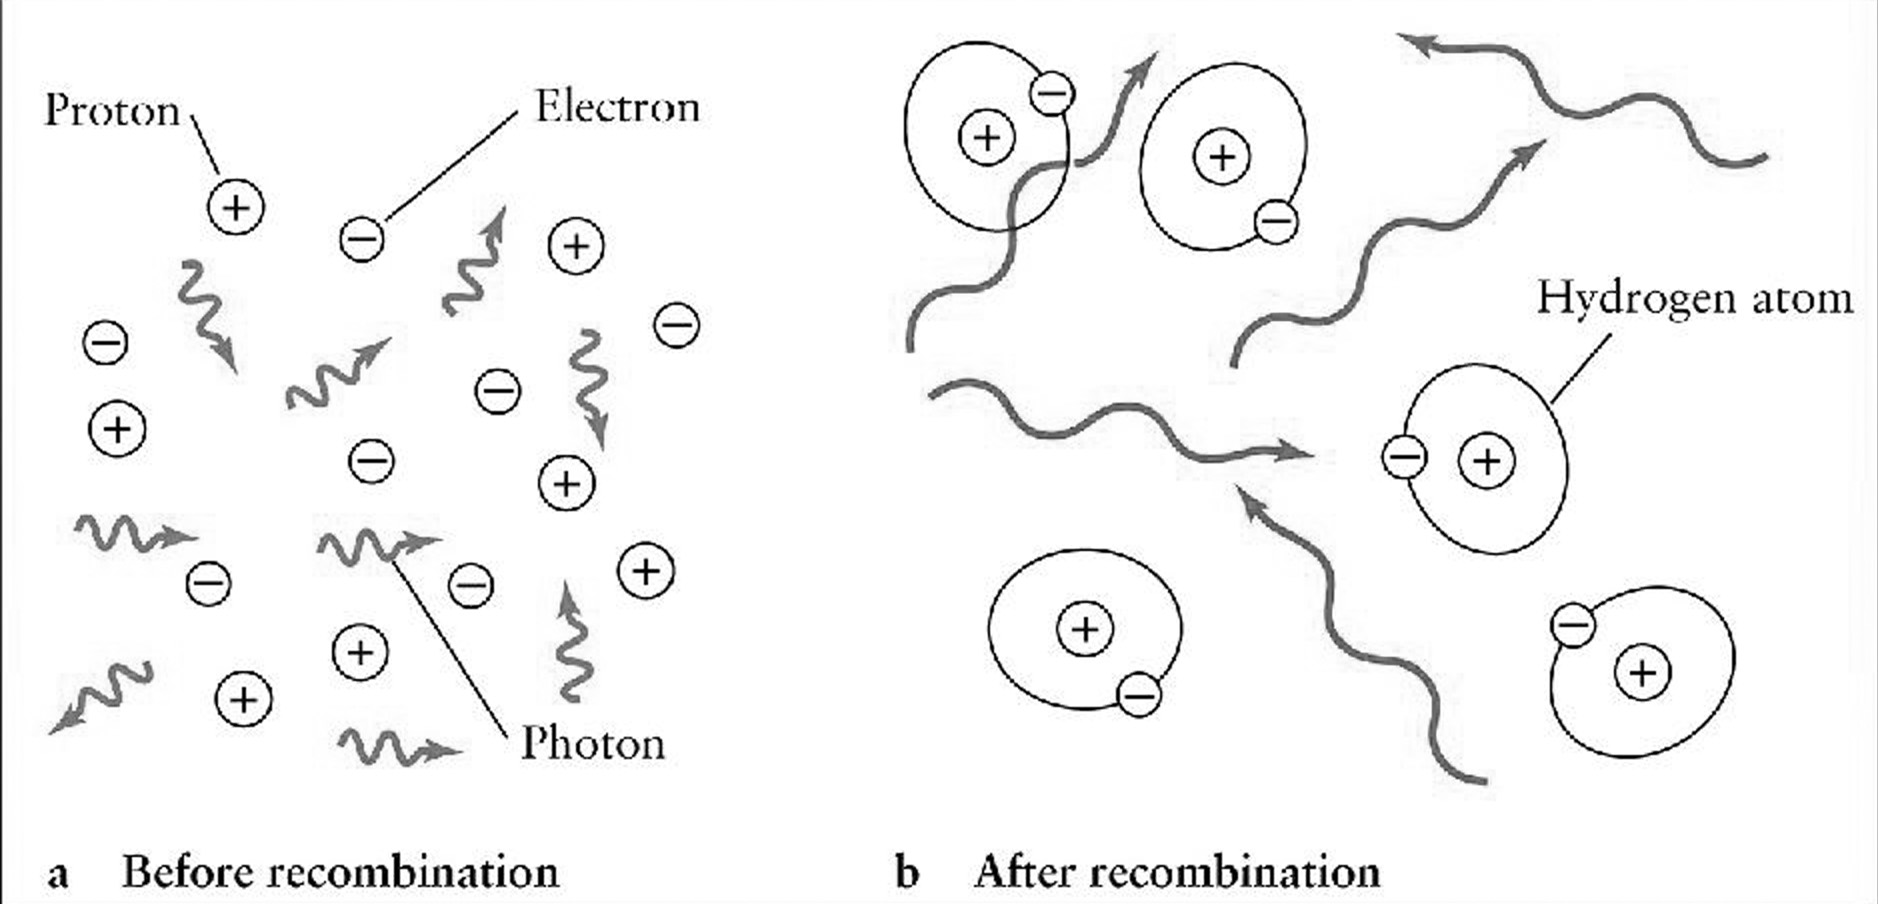 |
The change in absorption by the matter came about when the electrons combined with the nuclei, and suddenly only the photons at the specific line energies for the atoms were absorbed -- the Universe became mostly transparent, and the matter and radiation "decoupled". The matter was free to cool below the temperature of the photons, and the photon field no longer changed its properties through interactions with matter. from Clem Pryke, http://find.uchicago.edu/~pryke/compton/flyer.html |
This point in time is called recombination because the electrons "recombined" with the atomic nuclei (yes, it is a bit of a misnomer since there was not a previous era when they were combined!).
The photon field is what we now see as the remnant from the Big Bang and is the radiation discovered by Penzias and Wilson. The Universe has expanded by a factor of 1000 since it decoupled from the matter so this radiation has been redshifted by a factor of 1000 from T~3000K to T~3K. However, the photons still retain the distribution they had when they decoupled from matter, and at that time they reflected the distribution of the matter.
 |
We can study this "surface of last scatter" (Illustration from the MAP Project) by measuring the distribution of the cosmic 3K radiation. |
Two key discoveries of the COBE satellite are: 1.) the perfect black body character of the cosmic background; and 2.) minute differences in the strength of the radiation in different directions. These fluctuations or "anisotropies" (also called Wrinkles in Time) are at a level of 6 parts per million. John Mather and George Smoot were awarded the Nobel Prize for these discoveries.
 |
Here is an all-sky map from COBE. The sky is extremely uniform at wavelengths near 1 mm! (illustrations from Wayne Hu, http://background.uchicago.edu/~whu/physics/physics.html) |
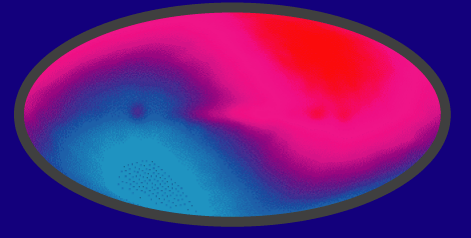 |
Here is how it looks if we increase the contrast 1000 times. We see the Doppler shift of the cosmic background due to the motion of the earth through space, but not much else. This distribution is called a "dipole." (from Wayne Hu, http://background.uchicago.edu/~whu/physics/physics.html) |
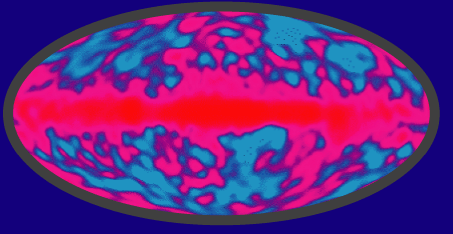 |
If we remove the dipole mathematically, and then increase the
contrast to 1 part in 100,000, the sky looks like this. Ignore the bright red feature
across the middle: it is just our galaxy, the Milky Way. Instead, look at the structures all over the
sky. (from Wayne Hu, http://background.uchicago.edu/~whu/physics/physics.html) |
The Wilkinson Microwave Anisotropy Probe (WMAP) has supplanted the COBE results with a much better all-sky map: (From http://imagine.gsfc.nasa.gov/docs/features/news/10mar08.html). All the structures represent subtle density variations at the surface of last scatter, and they have persisted to define the large-scale organization of the space around us today.

|
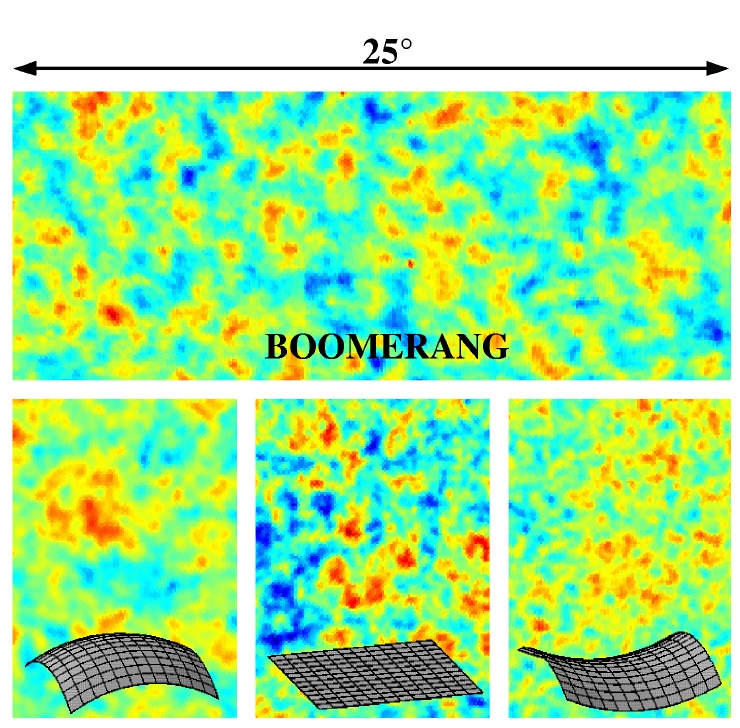 |
Here are data from the Boomerang experiment, and below some theoretical predictions
of how the sky might look if the Universe is closed, flat, or open. The positive curvature
of the closed Universe results in much greater magnification of the fluctuations (to the
far left) than does the negative curvature of the open Universe (near left). (from
Boomerang Project, http://www.physics.ucsb.edu/~boomerang/press_images/index.html)
and Clem Pryke, http://find.uchicago.edu/~pryke/compton/flyer.html
|
These experiments all agree
that the Universe is exactly "flat", ![]() =
= ![]() critical.
critical.
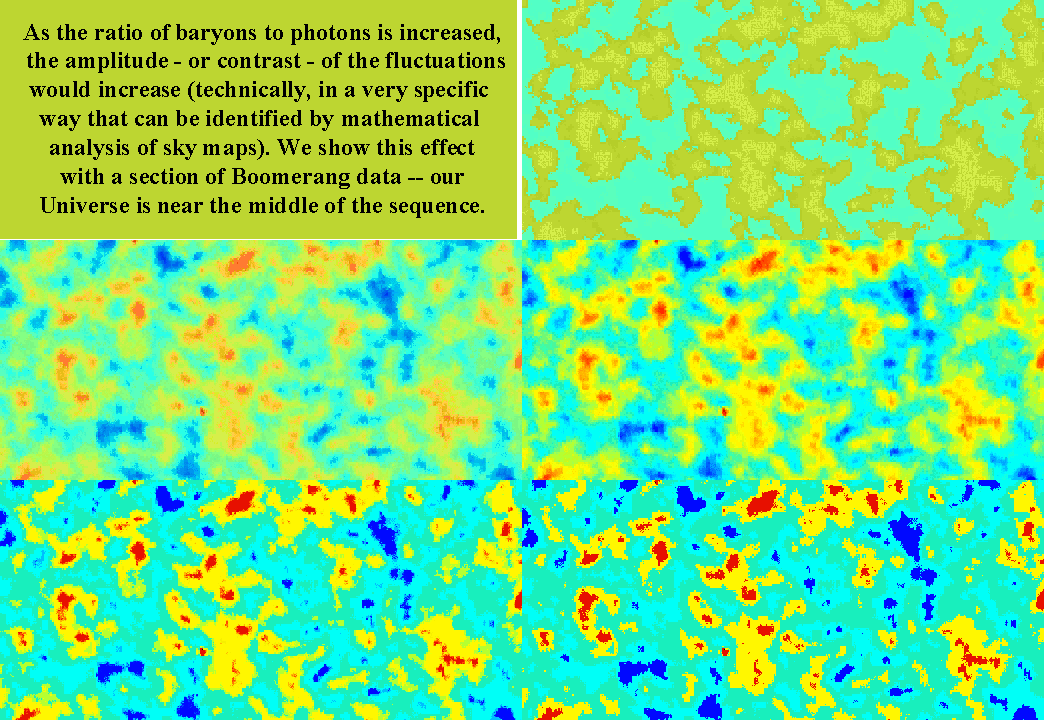 |
These studies let us learn about many other aspects of the early Universe, for example the relative number of "ordinary" particles like protons, neutrons, and electrons -- all called together "baryons"-- can be learned by measuring the contrast of the fluctuations. (animation by G. Rieke) |
We can explain this behavior by an analogy. Wherever small increases in the density of the dark matter occurred, the gravitational attraction made them grow into mass concentrations, carrying the normal matter with them. Before recombination, the pressure of the photons and the force of gravity opposed each other in determining how baryons behaved. The dark matter could "pile up" and provide centers of gravitational attraction, but the photon pressure would tend to push the baryons into a perfectly uniform distribution, like that of the photons themselves.
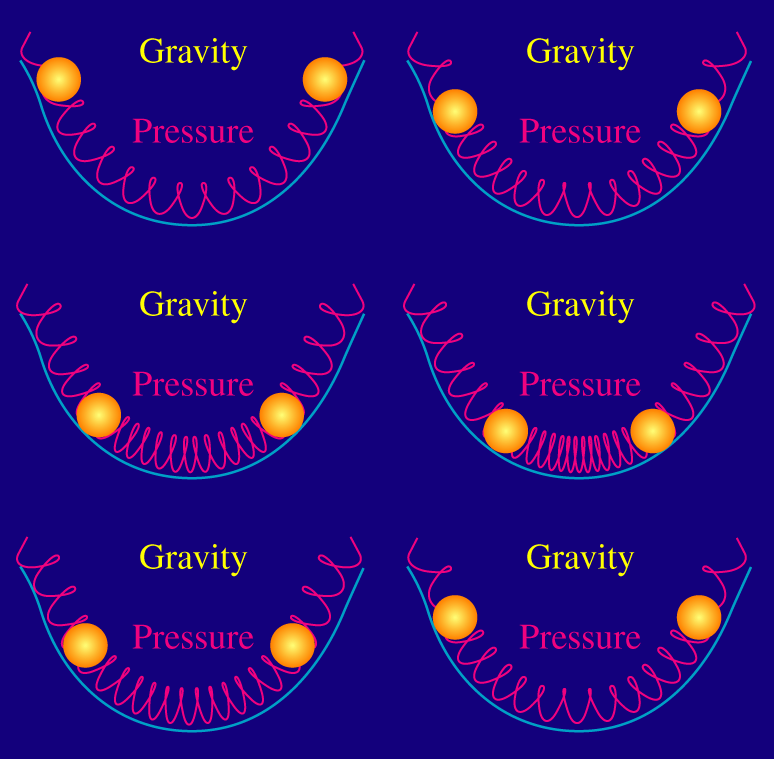 |
The behavior is like two massive balls trying to fall (under gravity) into a groove, opposed by a spring to represent the photon pressure. (From W. Hu, http://background.uchicago.edu/~whu/physics/physics.html). Because nothing removed energy efficiently, the early Universe was full of oscillations around the gravitational centers established by the dark matter. |

Here is our original illustration of the transfer of energy back and forth between gravitational potential energy (when the ball is at the top of the motion) and kinetic energy (when it is moving fastest, at the bottom). The new, more complex diagram is to show the transfer when we can store potential energy in either the gravitational field, or the pressure of the photons. From Scott Anderson, copyright open course, http://www.opencourse.info/ |
The diagram above is another form of energy conservation illustration. When the spring is compressed, it has maximum potential energy - it can do work by pushing on the balls and making them move. When that happens, the balls acquire kinetic energy and move up the gravitational field, acquiring gravitational potential energy. Eventually, all the kinetic energy from the spring has been converted to potential energy in the gravitational field, and then it gets converted back to kinetic energy as they start to fall down the slope. This process compresses the spring, so the energy becomes potential energy in it, and the cycle repeats. |
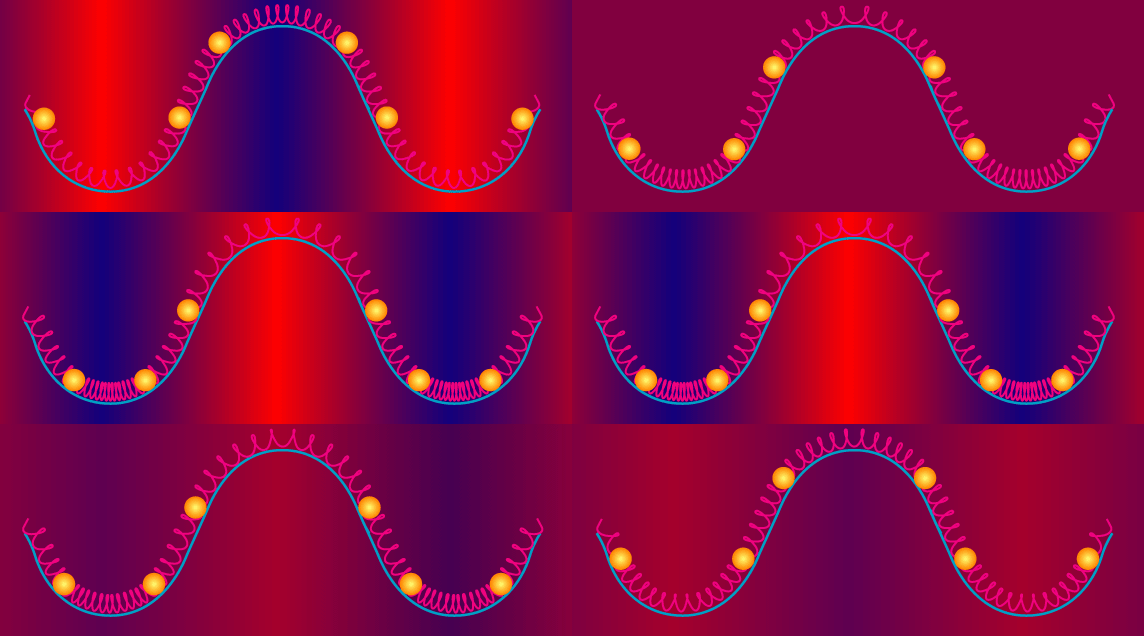 |
Where the photons got compressed, they were heated, producing slight increases in the apparent brightness (in this case, "heating" refers to a Doppler shift to the blue). As usual, this animation shows warmer as blue and cooler as red. These fluctuations are seen at the surface of last scatter, frozen at one moment in the development of the Universe. (from Wayne Hu, http://background.uchicago.edu/~whu/physics/physics.html) |
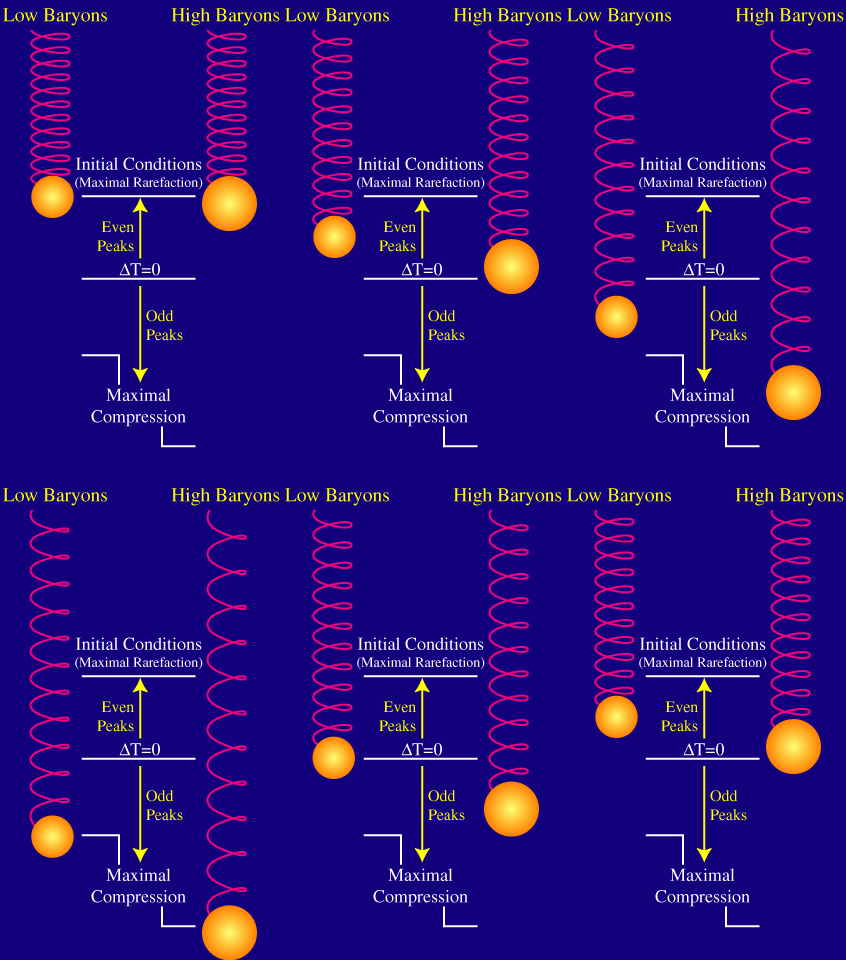 |
If the baryon fraction were high (larger, more massive
ball in our analogy), then the oscillations would be larger, and the
compression of the photons greater, producing larger fluctuations in the
brightness of the surface of last scatter. (from
Wayne Hu, http://background.uchicago.edu/~whu/physics/physics.html) This behavior is illustrated in the animation above using the Boomerang data. The Boomerang, Maxima, and other data indicate that the baryons are only a small fraction of the total mass of the Universe, in agreement with other evidence. |
Summary:
The spacing of the peaks in the cosmic background tells us the Universe is flat, while their contrast indicates that baryons are a small fraction of the total mass. The peaks represent concentrations of matter that are the seeds for the growth of large scane structures that dominate the structure of the Universe today. Additional constraints on the Universe can be determined from other aspects of the behavior of the anisotropies in the background.

Chinese mythology: In the beginning, the universe was nothing but swirling vapors and chaos. From these vapors, the forces of Yin and Yang emerged. The two forces combined to create all things, and all things created contained elements of both. http://tlc.discovery.com/convergence/eden/myths/myths_10.html |
Schematic of a helium atom |
|
Click to return to syllabus |
||
| Click to return to the Era of Nucleosynthesis | hypertext |
Click to go to the Eras of Atoms |